Useful tools in spreadsheets for reporting purposes
Spreadsheets have many benefits, they are familiar, easy to change, functioning is rather transparent (if you do not use too many macros). You can create charts, use predefined templates (you can download some from Google Marketplace or from Microsoft too).
Streamlined data entry
A spreadsheet is well suited to mass data entry. Excel files are often used to share financial data with partners. Google Sheets can also export data into excel format. You can also import data from excel and csv files, even from databases into both products.
Visual financial analysis
Financial analysis doesn’t have to be just some tables or a list of accounting ratios that assess your company’s profitability. Excel and Google Sheets can create all sorts of charts that show where your business’s money is going.
Templates
Microsoft has thousands of free Excel templates on its website. Rather than having to design your own invoices and expense reports from scratch, you can download and tweak someone else’s creation.
Designing your own accounting templates requires 100% precision; if one cell isn’t working correctly, you might wind up with errors in your accounting records. Templates are plug-and-play with pre-filled formulas.
Start exploring capabilities of spreadsheets by downloading an expense report or invoice template and tweaking it to fit your business. Soon enough, you’ll gain the know-how to implement it more widely in your company.
Handy formulas and Macros
Excel and Google Sheets formulas significantly speed up business expense tracking and analysis.
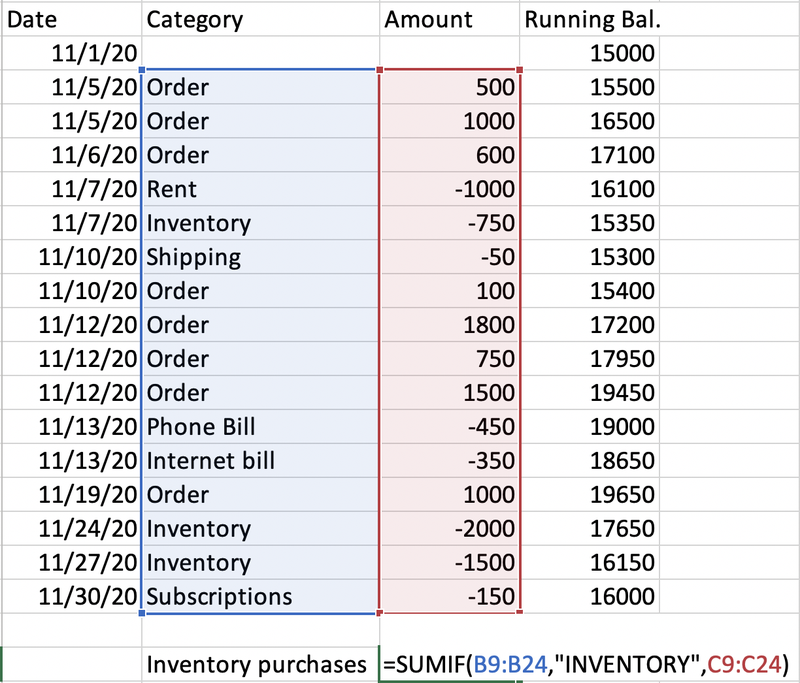
Say you’re looking at the bank statement below and want to know how much the business spent on inventory purchases. Rather than adding up a list of the applicable expenses using a calculator, you can use the “SUMIF” formula, instructing it only to add expenses marked as inventory purchases.

For more complex cases you can use more complicated functions or even macros (scripts in Google Sheets) that can generate the result for hours of a human’s work in moments. These algorithms can be used to automate tasks, such as formatting, filtering, and running basic analysis.
Pivot tables
PivotTables are one of the biggest help in reporting, it is very powerful tool that can reorganize data to present it in a more understandable format. It is very flexible if you know how to use it.
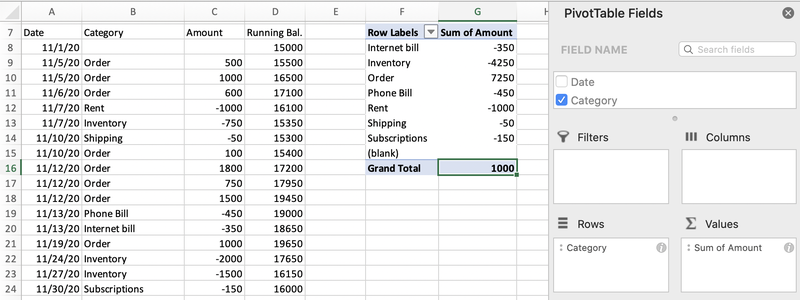
You can process bank statements, which typically list transactions chronologically, but a huge list does not help much to understand where your money went that month. A PivotTable (see below) can categorize income and expenses on the adjacent bank statement. It collapsed the order and inventory transactions into one line to delineate how much the company earned in revenue and spent on inventory purchases. The total row reflects the company’s net income for the month.

The example shows just a month’s worth of transactions, but imagine your spreadsheet lists of transactions for an entire year. You could use a PivotTable to separate your transactions by month to better understand your company’s cash flow. That would take hours by hand, but it’s only moments with PivotTables.
Save and secure information
Anywhere you store financial information should be secured by a password that only a privileged few know. Password-protect files with sensitive information, such as employee Social Security numbers. Don’t forget to back up files that aren’t stored in a cloud storage system.
Spreadsheets for small business accounting
Excel can help you with countless aspects of your small business accounting.
Budgeting
Although many accounting software platforms have budgeting features, spreadsheets are very flexible.
Start your business budget by exporting an income statement from your accounting software to a spreadsheet. Clear out the numbers and add columns for each month of the period for which you’re budgeting. Then start entering your budgeted numbers. As your business’s finances get more involved, you can create granular sub-budgets that roll up into your business’s master budget. You can use formulas, ratios, checks that rows add or subtract correctly, etc.
It is good practice to avoid “hardcoding” numbers whenever possible. Imagine you’re building your company’s budget for next year. You plan to pay all employees the state minimum wage of $12 per hour. You later learn that the minimum wage is going up to $15 next year. If you created the budget using formulas the first time, this fix should take no more than 30 seconds.
Hardcoding a number means entering an actual number, not a formula, into a cell. The only numbers hardcoded below are the $12 minimum wage and the monthly hours for each employee. Formulas calculate the employees’ monthly gross pay.

Expense reports
Every time you reimburse an employee for mileage or another business expense, you should ask for receipts and an expense report that tallies all costs in one document. There are hundreds of expense report templates to choose from online.
Accounts receivable and accounts payable
Many small businesses track who owes them and whom they owe with a spreadsheet.
Businesses on the cash accounting method only record revenue and expenses when money comes in or out. A spreadsheet is the perfect repository for a list of outstanding client invoices and your business’s unpaid bills since they have no place in your accounting records until cash changes hands.
Accrual-basis businesses record receivables and payables in their accounting software when they earn revenue and incur expenses, respectively. But they also need to track which invoice was paid, etc.
Bank reconciliations
Bank reconciliations, one of the bookkeeping basics, compare your company’s accounting records with its bank statements. You can put both side by side in a spreadsheet and quickly scrutinize any discrepancies. A spreadsheet has a no-frills interface. Start the bank reconciliation by downloading your company’s general ledger and bank statement. Then, copy and paste the data into one spreadsheet and start reconciling.