
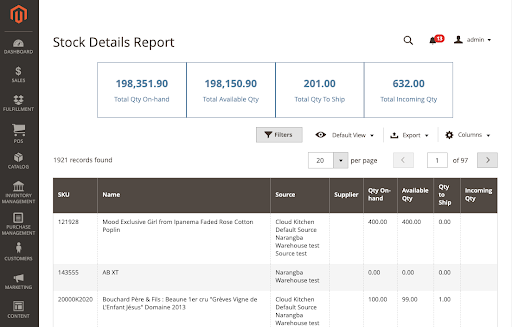
Inventory On Hand
If your retail constantly runs out of stock, your customers will shop at your competitors instead. To make sure that the products in your store are always ready to sell, you should know what items are running out of stock. This inventory on hand report will show you a detailed overview of your inventory with a list of all the products and variants that you have in stock by each warehouse/store.
That information tells you how much capital you have in your inventory, which in turn can help you in your financial plans and forecasts. For example, knowing how much capital you have tied up in stock (i.e., current stock value), is quite handy when you’re budgeting for next season.
Here are the key metrics on an inventory dashboard:
- Product Name
- Supplier
- Location where the inventory on hand is stored. If you store the same product at multiple locations, there might be a separate entry for each location.
- Cost: the cost to your business for one unit of the product.
- Starting Inventory: the number of units of a product on hand at the beginning of the selected date range. For example, if you are looking at the report for the month of August, this column displays the number of units on hand on August 1st.
- Received: the number of units of the product added to your inventory during the selected date range.
- Usage: the number of units of the product sold during the selected date range.
- On Hand: the current number of units of the product held in inventory.
- Variance: the number of units of a product not accounted for. This number is calculated by taking into account the numbers listed in the Starting Inventory, Received, Usage, and On Hand columns.
- On Hand Value: the total cost to your business for the units of a product held in inventory at the location. This number is calculated using the cost of the product.
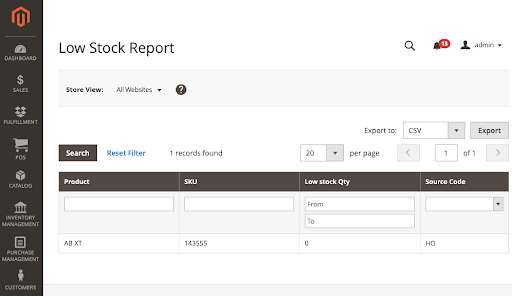
Low Stock
Out of stocks are a no-no in retail. Not only do they lead to lost sales, but out-of-stocks also result in reduced customer satisfaction and can send people straight to your competitors.
Prevent that by regularly generating stock reports that display items that are running low. For best results, set a re-order point for your products and make sure that you’re notified when your stock levels reach a certain point so you can replenish as necessary.
The low stock report lists all products which are low on inventory based on minimum stock levels (or re-order thresholds) defined against each product. If the current on-hand inventory is above the product minimum level or the product has no minimum stock level set, it will not be displayed on the low stock report.
Looking at low stock reports on a regular basis can also enable you to spot patterns around which products are constantly running low. If a particular is always showing on this report, for instance, that could indicate the need to increase your order quantities.
Key metrics:
- On hand quantity: the total you have physically available (including Qty Reserved), minus any items that have already been reserved for a sales order.
- Minimum stock: the minimum quantity you set on each item.
- Other measures:
- Manufacturer/Supplier
- Incoming quantity
- Unit of measure
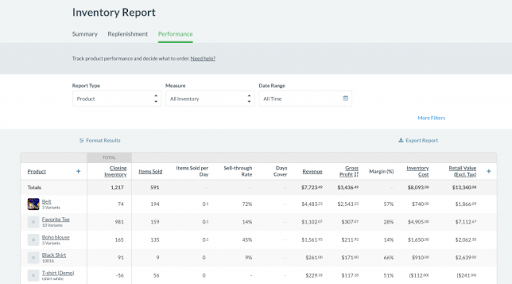
Product Performance Report
How fast are items selling? Which products are making the most money? Such questions can be answered by your product performance report.
Ideally, this report should tell you how much merchandise you’ve sold over a given time period as well as a summary of items sold per month or per week. Use the product performance report to determine which items are worth investing in and which ones shouldn’t be re-ordered.
By looking at when sales spike and which products are selling the most, you can get a clearer idea of how many units to order. You can also compare the sales velocity for specific products and their overall categories, because this gives you an idea of which related products are going better.
Inventory aging report
This report gives you a rundown of the number of days you’ve been holding stock and the quantity. It’s important to keep tabs on how much inventory is sitting on the shelf and for how long.
The inventory aging report provides business with insights such as:
- Slow-moving items
- Non-moving items
- The length of time your products sit in inventory
- The cost of maintaining inventory for long periods of time
This will give you a better understanding of what products customers are buying versus products they are not purchasing so that you don’t invest a lot of money into products that will never sell.
Metrics:
- Average age in days: the report shows the average aging metric by days. To calculate the average age of inventory, you need to take the average cost of inventory and divide it by the cost of goods sold for the period. Then, you take that result and multiply it by 365 to get the average age of inventory.
- Other measures:
- Cost of inventory
- Average cost of inventory
- Cost of goods sold
- Time to pay for suppliers
Turnover inventory report
Most often, turnover is used to understand how quickly a company collects cash from accounts receivable or how fast the company sells its inventory. You can use the inventory turnover report to evaluate year-to-date inventory turnover. Analyzing high and low turnover items can help determine which items are overstocked (low turnover rate) and understocked (high turnover rate).
If the inventory turnover for a particular item is too high, it could be an indication that you need to order more of it. Inventory turnover is low when the demand is low or when it becomes deadstock inventory. If it’s because of fewer sales, the inventory manager should talk with the sales manager about sales policy or promotion. If it’s because of outdated or obsolete items, you can return or remove them to save storage cost.
Metrics:
- Cost of goods sold: cost of goods sold is an expense incurred from directly creating a product, including the raw materials and labor costs applied to it.
- Average inventory: the average cost of a set of goods during two or more specified time periods. It takes into account the beginning inventory balance at the start of the fiscal year plus the ending inventory balance of the same year.
- Inventory Turnover Ratio = (Cost of Goods Sold)/(Average Inventory)
- Other measures:
- Units of measure
- Opening and closing stock
- Goods issued during the reporting period
- Min stock levels
- Lead times
- Next reorder point
- Last receipt date