A sales report gives you access to invaluable data about your customers and market trends. It also gives you critical information about your company’s own performance. You can get answers to some very important questions like…
- What are your most profitable products and services?
- Which goods are slow-moving?
- Who are your most profitable customers?
- What sales prospects and problems you have?
Reporting
When you write a report, you need to keep your final objectives in mind. To master the report writing, there are a couple of crucial questions that you need to ask yourself: who are you reporting for, and why? Is this a weekly check-up or an assessment of a situation or a campaign project? What is the time period of the report? What is the main message you want to share? Once these questions have found an answer, you can easily articulate your report accordingly.
- Define your audience: before writing, think about who will read and what they need to know. Consider their background as well and if they are familiar with the jargon you might use. It’s not the same if you write for a specific sales audience or a general one.
- Define the purpose of your report: sharing monthly advancement with top management, or just having the weekly overview and analysis of the sales objectives with your team. Both reports will have a different structure and the info you will share will also be very different.
- Decide on a time period: that means that you can create a daily as well as a monthly report, or choose to display the data of the last quarter or year.
- Gather the right data: since you have set specific KPIs to track, you now just need to compile them all together and analyze them.
- Visualize and communicate your findings: the most important part, once you have analyzed and dug out insights from your data, is to convey this information to your audience. Using a professional dashboard that works with real-time data will always let you up to date when sharing your insights.
Sales Summary
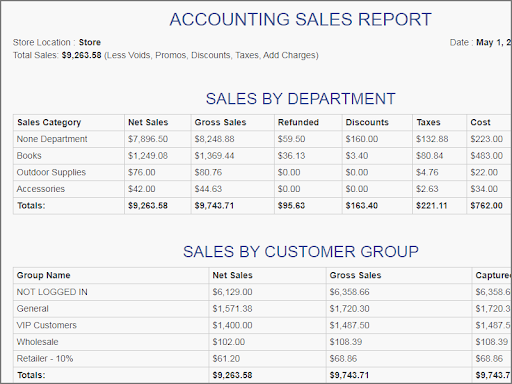
This report gives you an overview of your sales for a given time period. Your sales report should also show your cost of goods sold, gross profit, margins, and tax, so you can have a better idea of how much money is actually going back to your business.
The sales summary report provides a more macro view of your retail sales. How much did you make last month or the previous month? What about your year-to-date sales compared to last year? These numbers offer some general insights around the health of your business, and they can inform your medium to long-term decisions.

Sales Report Per Product and Product Group
Having an overview of sales is great, but to get even more meaningful insights, you also need to be granular with your analytics. This is where sales per product reports come in.
This type of report makes it easy to identify your best (and worst) selling products, so you can determine the right course of action. If a particular product is selling well, for example, you could consider ordering more of it. On the flip side, if a product isn’t performing, then you’d want to know sooner rather than later so you can run promotions before the season ends.
Sales per product type, on the other hand, helps you get a handle on your revenue from a category level. This is a great report to run if you want to identify broader trends or insights.
Let’s say you’re a footwear retailer and you notice that a particular brand or style of shoes is quickly gaining in popularity. Or, perhaps you’ve noticed that certain shoe sizes sell more quickly. You can use those insights to influence your stock ordering and marketing decisions for the rest of the season.
Sales Report Per Customer or Customer Group
It’s a good idea to generate “sales per customer” or “sales per customer group” reports. This will allow you to identify your VIP customers as well as those who aren’t fully engaging with your brand, so you can tailor your marketing and communications accordingly.
If you know who your top customers are, you could create special VIP events or programs to drive loyalty. On the other hand, if you’re looking to engage inactive customers, this report will help you identify them easily.
Sales Funnel Reports
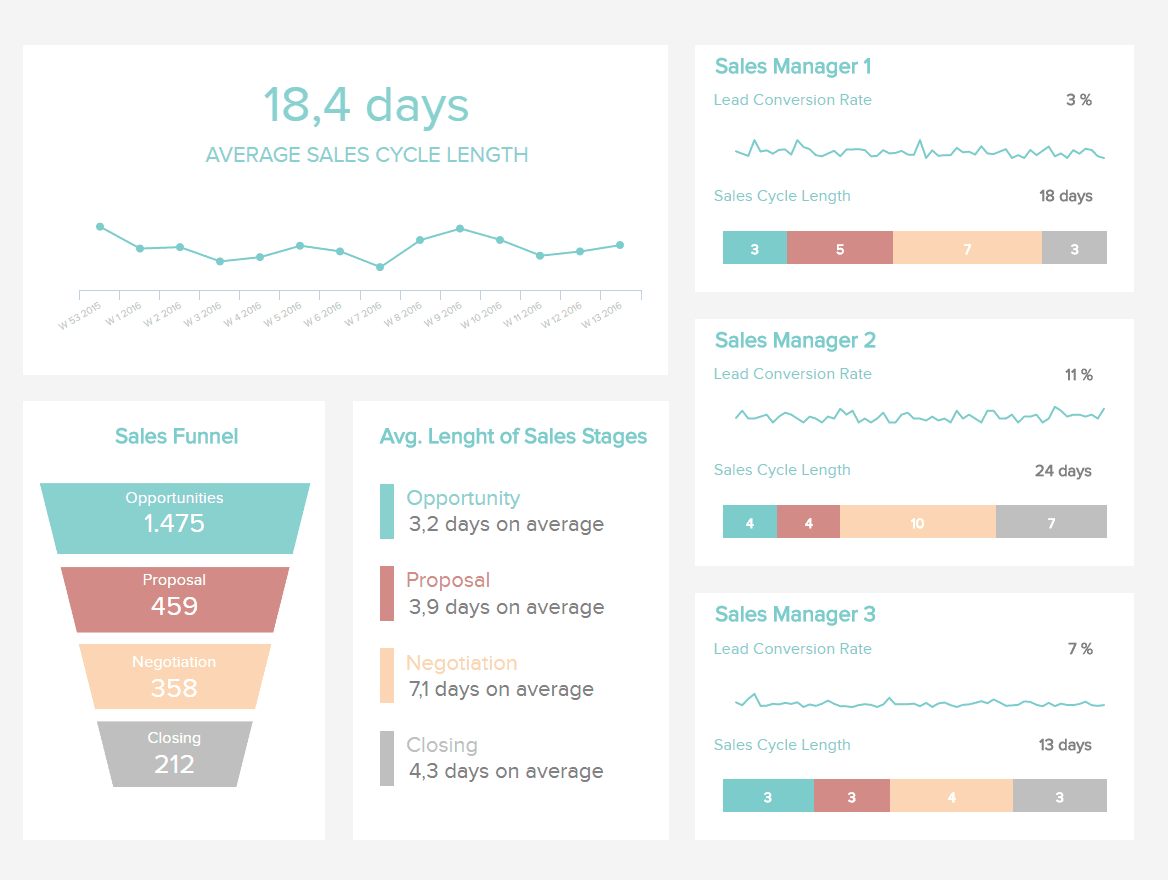
This sales report is covering the totality of your sales funnel, from the opportunity to a closed deal. If you also record which of your sales reps is associated with the opportunity/sales, this report can outline the performance of your reps as well and point out how good they are at closing deals, and how long it takes them to get there.

This report gives you an overview of your cycle while monitoring the conversion rate and cycle length of each sales manager on your team. The goal is to shorten the sales cycle as much as possible but it also depends on the industry. In B2B, the cycle length is usually much longer than B2C.
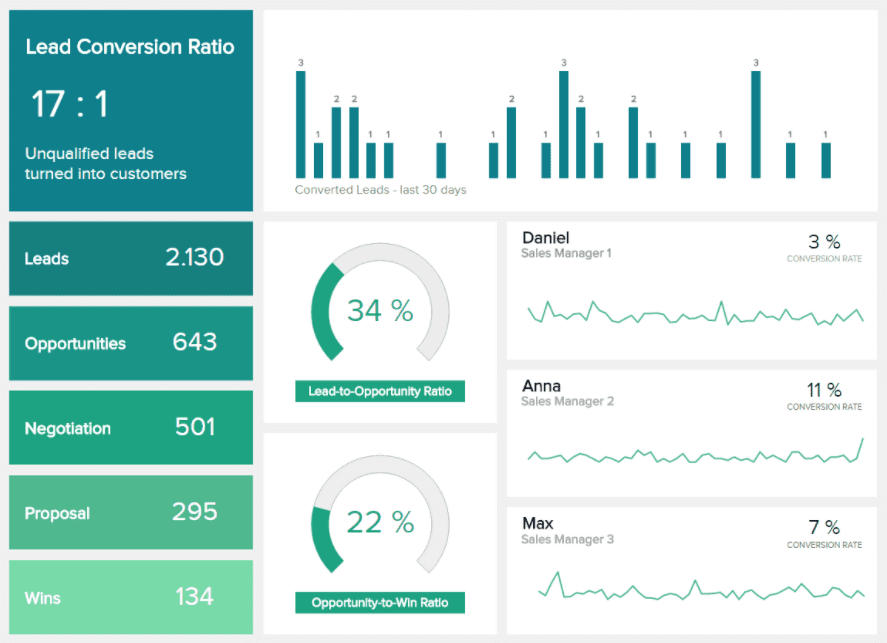
You are also able to see how effective your reps are at converting the leads into sealed deals, after hitting every step of the funnel to get there.

By analyzing each stage of this funnel, you have the opportunity to identify where an issue may occur and address it, so as to increase your sales conversions. The monthly development is depicted on top where you can see how many converted leads you gained in the last 30 days. You can also see 2 gauge charts that visualize the lead-to-opportunity and opportunity-to-win ratio. If you see that the opportunity-to-win ratio is stagnating or decreasing, you can examine what kind of problems your reps have at the later stages of sales.